Statistics
You will find on this page a statistical study of the database population :
distribution by color, country, etc.
By year distribution
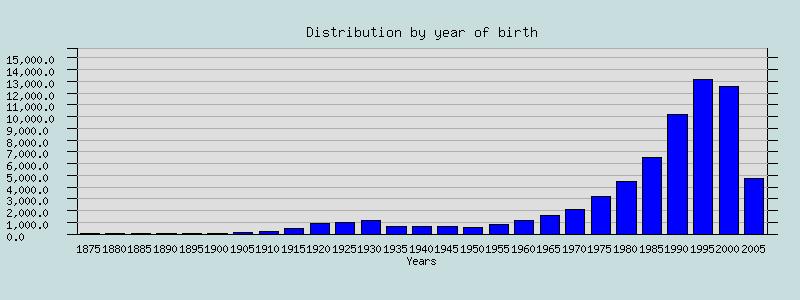
The following chart shows the distribution of the dogs in the database
by year of birth. Years are grouped five by five (from 1875 to 1879, from
1880 to 1884, and so on).

By color distribution
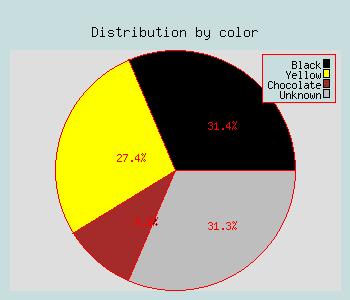
The following chart shows the distribution of the dogs in the database
by colors

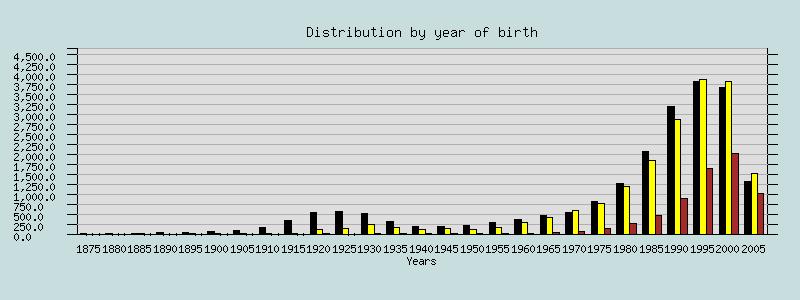
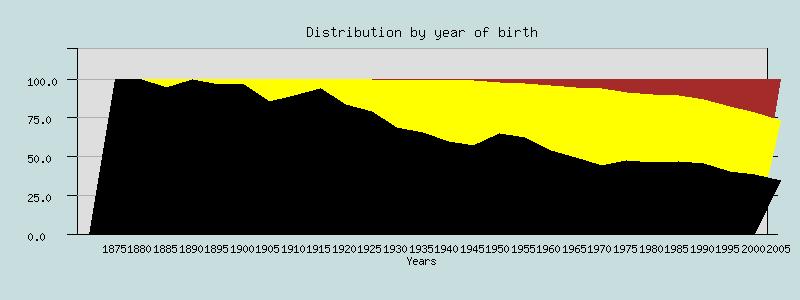
Color distribution along the years
Here is the evolution of the color distribution along the years:

which gives in percentages:

Distribution by countries
| Country | Number of dogs |
| United Kingdom | 21105 | | United States | 12281 | | France | 10751 | | Sweden | 5319 | | Finland | 2328 | | Italy | 1602 | | Netherlands | 1595 | | Australia | 1558 | | Canada | 1312 | | unknown | 981 | | Belgium | 914 | | Germany | 846 | | Russian Federation | 662 | | Portugal | 599 | | Spain | 569 | | Denmark | 468 | | Norway | 456 | | Hungary | 422 | | Ireland | 376 | | Czeck Republic | 359 | | Brazil | 335 | | Poland | 320 | | New Zealand | 309 | | Switzerland | 304 | | Austria | 219 | | Philippines | 177 | | Croatia/Hrvatska | 175 | | Mexico | 142 | | Colombia | 110 | | Argentina | 64 | | Ukraine | 57 | | Slovak Republic | 47 | | Thailand | 43 | | Japan | 40 | | Ex U.S.R.R. | 33 | | Slovenia | 30 | | Greece | 26 | | Yugoslavia | 24 | | Chile | 21 | | Jersey | 19 | | South Africa | 18 | | Isle of Man | 16 | | Estonia | 13 | | Lithuania | 10 | | Mozambique | 7 | | Kenya | 7 | | Indonesia | 7 | | Latvia | 7 | | Tanzania | 6 | | Bulgaria | 6 | | Luxembourg | 5 | | China | 4 | | Peru | 2 | | Taiwan | 2 | | India | 2 | | Israel | 1 | | Cuba | 1 | | 1 | | Djibouti | 1 | | Iceland | 1 |
| 
